What Is The Money Flow Index? 3 Simple Money Flow Index Trading Strategies
Understand Price and Volume, and how these can affect market, is important in trading
In the past few weeks, we have focused on a number of technical indicators (our review of how the Parabolic SAR and the directional movement index works).
Đang xem: What is the money flow index?
In these articles, you have learned about how you can use these technical indicators successfully in the market. This time, we will look at another indicator that has become relatively popular.
In this article. We will look at the Money Flow Index (MFI) and how you can apply it successfully in the financial market.
What is money flow index indicator?
Money flow index was created by Gene Quong and Avrum Soudak. You will find the indicator in all trading platforms like the MT4 and our PPro8.
The MFI is a leading indicator that uses price and volume to show whether the price is overbought or oversold. The index is usually positive when the price is rising and negative when the price is falling.
The best way to think of the MFI is to consider the RSI, which we covered before. Basically, Gene and Avrum understood the importance of volume and how it affects the markets. They therefore added volume to the calculation of the MFI.
How to Calculate: MFI formula
The MFI is calculated using a very simple formula. As we have written before, you don’t need to know how these indicators are calculated.
While we have been in the trading business for many years and use these indicators often, we don’t know how most of them are calculated.
The MFI is calculated as follows:
You calculate the Typical Price (TP). You do this by adding the high, low, and close prices and then dividing the total by three.After finding the typical price, you calculate the Raw Money Flow. You do this by multiplying the Typical Price with the volume.Calculate the Money Flow Ratio. You do this by dividing the period (often 14) positive money flow by the period negative money flow.
Finally, the MFI is calculated by using the following formula.
| Money Flow Index = 100 – 100 / (1 + Money Flow ratio) |
Money Flow Index vs RSI
The MFI is usually interpreted in a similar way to the RSI. The big difference between the two is that the MFI incorporates volume. Because of this, the MFI tends to act a bit differently with the RSI because volume leads prices.
For starters, the Relative Strength Index (RSI) is a technical indicator that is classified as an oscillator. It basically measures the speed of change of a financial asset and helps to identify overbought and oversold levels.
The RSI is calculated using the formula below.
| RSI = 100 – 100/ 1 + RS |
where the RS refers to the relative strength.
When applied in a chart, the RSI and MFI usually look the same, as shown in the chart below. The purple indicator is the RSI while the green one is the MFI. As you can see, these indicators always move in the same direction.
Xem thêm: Có Nên Đầu Tư Đồng Ripple – Tạo Ví Và Mua Bán Đồng Xrp Coin Ở Đâu
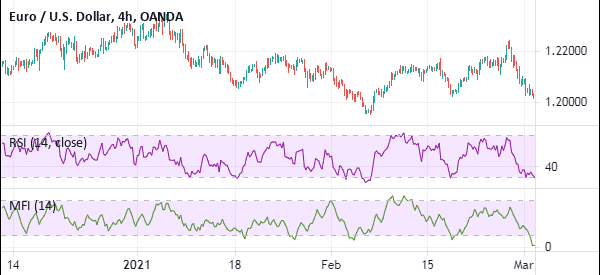
RSI VS MFI
A key difference between the RSI and the MFI is the default locations. In the RSI, the default oversold level is 30 while the overbought is at 70. In the MFI, the two defaults are at 20 and 80, respectively.
However, you can always change these figures in the settings.
How to Use the money flow index
A good way to use the money flow index is to identify the overbought and oversold levels. When the MFI is above 80, the price is said to be overbought. It is said to be oversold when it is below 20.
However, as we mentioned when talking about the RSI, it is not mandatory that a reversal will happen the overbought and oversold levels are reached.
The price may continue to move higher when it reaches the overbought level of 80. It may also continue to move lower when it moves to below 20. This happens when there is a very strong trend.
The chart below shows the MFI in action on the Apple stock.
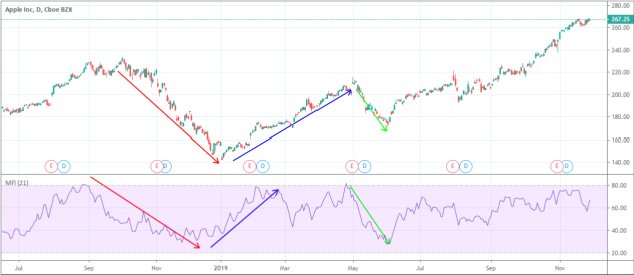
MFI on Apple Stock
Using the MFI to find divergence
Divergences refer to points where an asset’s price is rising while the indicator is falling and vice versa. Identifying a divergent period early enough can help you see when a reversal is about to happen.
First, you need to look at an asset’s price visually and see the initial trend. Second, you should look at the performance of the MFI and join the key levels.
In this case, if the price is rising while the MFI is moving lower, it could be a sign that a bearish trend is about to start. A good example of this is in the Microsoft share price below.
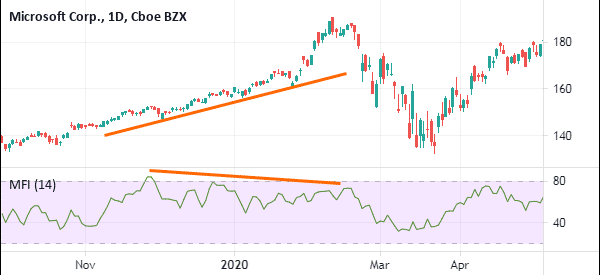
Divergence found in Microsoft Stock with MFI. Chart from Tradingview
As shown in orange, the MSFT stock price is generally in an upward trend. At the same time, joining the upper sides of the MFI shows that it is moving lower. Ultimately, the shares broke out lower.
This is a good example of how this divergence works. However, a key issue is that divergences are rare occurrences in the market.
In addition to identifying overbought and oversold levels, another key method of using the MFI is to follow the trend. In this, you should buy the asset when the MFI is rising and vice versa.
Strategies for your Day Trading
As you can see, while the MFI is a good indicator, it can also show you the wrong signals. This simply means that it can decline when the price is rising. This happens when there are divergencies.
Xem thêm: Là Gì? Nghĩa Của Từ Orchid Là Gì ? Dịch Từ Orchid Từ Anh Sang Việt
A good way to avoid these situations is to combine a number of technical indicators and other analysis tools such as the RSI and Fibonacci Retracement.