Trading With The Pivot Point Indicator For Mt4 ), Best Pivot Point Indicator For Metatrader 4 (Mt4)
The indicator automatically draws important Pivot Points using the most popular methods: Classical (Floor), Camarilla, Woodie and Fibonacci
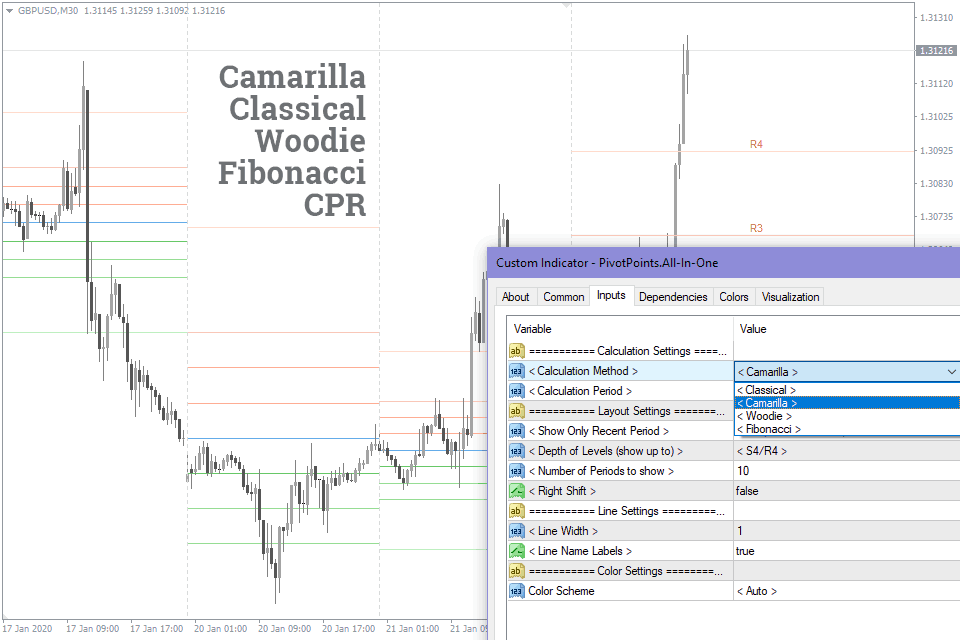
The indicator automatically draws important Pivot Levels in the MT4 terminal using the most popular calculation methods: Classical, Camarilla, Woodie, Fibonacci, CPR.
Đang xem: Pivot point indicator for mt4
It”s probably one of the best Pivot indicators for MT4. Also, it is absolutely free and available for download without registration.
How to Use Pivot Points
The very essence of trading with Pivot Points is based on the idea that the price tends to reach yesterday”s close point much more often than to overcome the previous day range. That”s why the most popular calculation period for Pivot Points is Daily.
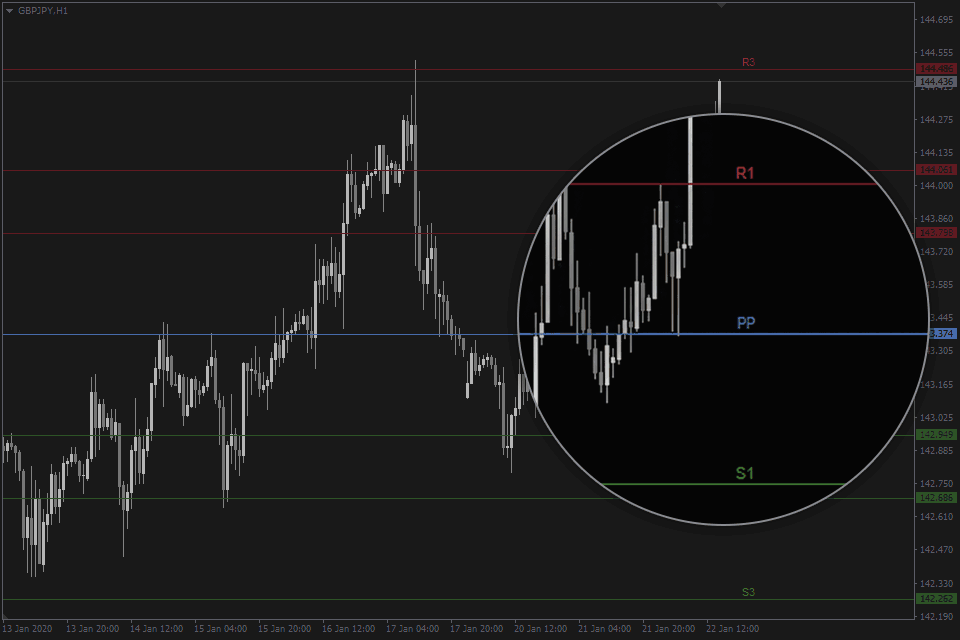
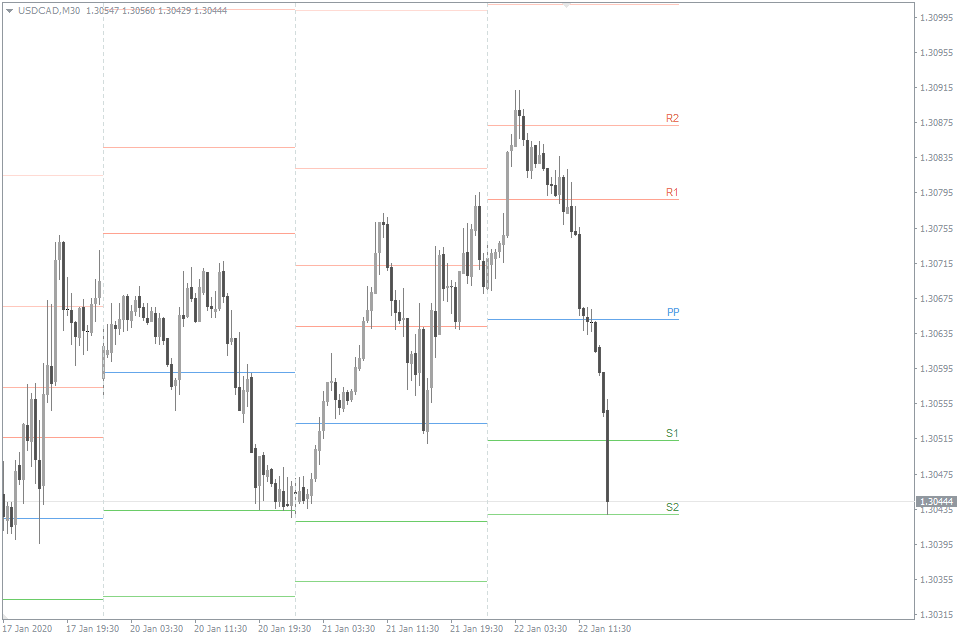
In that context, all Pivot levels play the role of support and resistance.
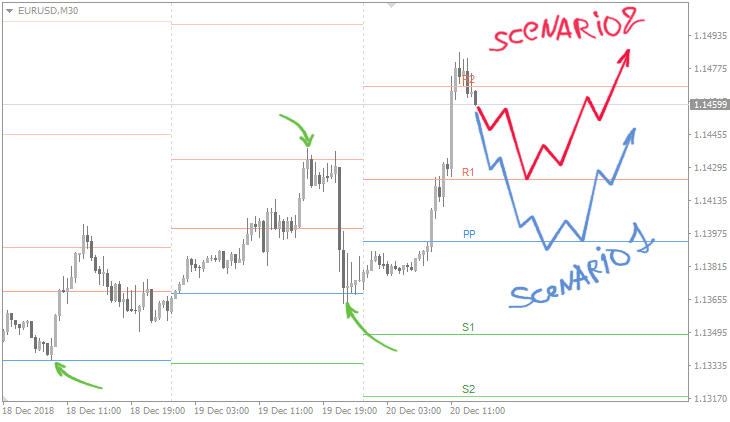
While analyzing the chart, we can see multiple price interactions with these levels.
Also, one of the advantages of the Pivot indicator is its popularity, as the more traders use the same tool, the more likely the price will interact with it.
Calculation Modes and Formulas
For calculating levels, HIGH (H), LOW (L) and CLOSE (C) data for the previous period are used, usually, it is a day, week, month or hour.
While calculating Pivots the concept of RANGE (R) is also used. Its value is determined by the formula: H – L.
PP – Pivot Point;S1-S4 – Support levels;R1-R4 – Resistance levels.
You should also consider the differences between the Forex market and the Stock market.
Initially, Pivot levels were used in the stock market, where the previous day”s closing price is very important and significantly affects the traders” behavior psychology during the next day. In contrast, Forex works around the clock, so the end of the trading day coincides with the beginning of the next one.
Classic (Floor)
The most common method of calculating Pivot Points. The main (blue) line here plays the role of a key support/resistance level.
PP = (H + L + C) / 3 R1 = (2 * PP) – L R2 = PP + RANGE R3 = PP + RANGE * 2 R4 = PP + RANGE * 3 S1 = (2 * PP) – H S2 = PP – RANGE S3 = PP – RANGE * 2 S4 = PP – RANGE * 3
Camarilla
Camarilla levels are located much closer to the current price, therefore, interactions with them occur much more often. This technique is suitable for those who perform short-term trades.
R1 = C + RANGE * 1.1 / 12 R2 = C + RANGE * 1.1 / 6 R3 = C + RANGE * 1.1 / 4 R4 = C + RANGE * 1.1 / 2 S1 = C – RANGE * 1.1 / 12 S2 = C – RANGE * 1.1 / 6 S3 = C – RANGE * 1.1 / 4 S4 = C – RANGE * 1.1 / 2 PP = (S1 + R1) / 2
Please note, above PP formula is somewhat different from the generally known Camarilla method. Here we offer you a modified calculation, as using the traditional approach, we get a level that does not correspond to the logic of other support and resistance levels.
Woodie
This technique is similar to the classical one, but more attention is given to the closing price of the period while calculating the basic PP line.
PP = (H + L + (C * 2)) / 4 R1 = (2 * PP) – L R2 = PP + RANGE R3 = R1 + RANGE R4 = R3 + RANGE S1 = (2 * PP) – H S2 = PP – RANGE S3 = S1 – RANGE S4 = S3 – RANGE
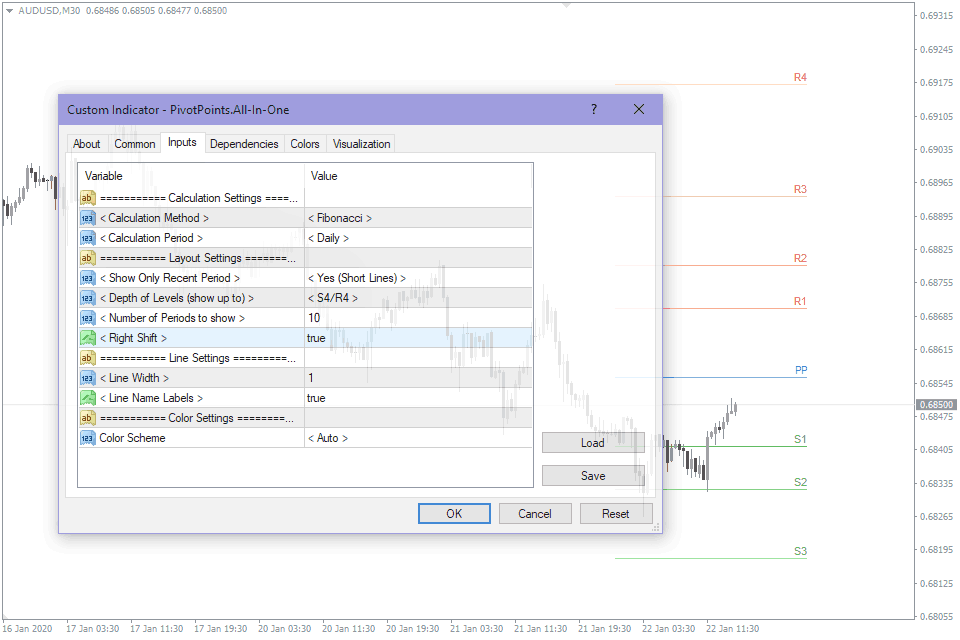
Fibonacci
The theory of Fibonacci numbers is commonly used in the Forex market. Pivot Points is not an exception. According to this method, the levels of resistance and support are determined by multiplying the range (R) to the corresponding Fibonacci numbers.
PP = (H + L + C) / 3 R1 = PP + (R x 0.382) R2 = PP + (R x 0.618) R3 = PP + (R x 1.000) R4 = PP + (R x 1.618) S1 = PP – (R x 0.382) S2 = PP – (R x 0.618) S3 = PP – (R x 1.000) S4 = PP + (R x 1.618)
Central Pivot Range (CPR)
It is a more expanded version of the classic Pivot Point calculation techniques. This indicator differs from the others in that it does not have usual support and resistance levels. Instead, here we have three pivot lines: a central one and the upper and lower boundaries, which form the Central Pivot Range.
Xem thêm: Sau Sảy Thai Nên Kiêng Gì Và Uống Thuốc Gì Để Nhanh Hồi Phục?
The CPR formula looks like this:TC = (Pivot – BC) + PivotPivot = (High + Low + Close)/3BC = (High + Low)/2
Here we have:TC – Top Central Pivot;Pivot – Central Pivot;BC – Bottom Central Pivot.
CPR helps a trader to forecast the future market situation by analyzing over days whether the pivots are higher or lower, or whether the range width is narrowing or widening.
For example, if CPR is narrow for multiple days, it usually indicates the major breakout or breakdown in the nearest future. Or when the market is closing with the price above the day”s CPR, it might be a signal for the bullish trends for the next day.
Which of these Pivot Points calculation methods is the best? There is no best or worst method. In fact, each of them can work, and you should make a choice based on your beliefs in trading.
Indicator Settings
The indicator is designed in the “All In One” format. This means you can customize it according to your wishes, as we did our best to include all of the most popular functions in this MT4 indicator.
Please, contact us if you have any special wishes or improvement ideas, we will gladly consider them.
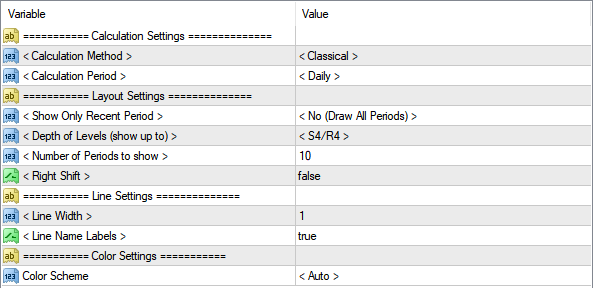
Calculation Method – select the method of Pivot Points calculation: Classical, Camarilla, Woodie, Fibonacci. The formulas for each method are described above.
Calculation Period – It determines the period for which the values of High, Low, Close will be taken.
Available periods:
Hourly;Daily;Weekly;Monthly.
Number of Periods to show. The number of previous periods to be displayed on the chart. This parameter is not taken into account if the option “Show only the current period” is set.
Show Only Recent Period. Display one or more calculation periods.
Depth of Levels – limits the number of displayed support and resistance lines on the chart.
Right Shift – continue the line to the full length of the right indent on the chart.
Color Scheme – automatic detection of the color scheme for the indicator. It is also possible to change the background color manually.
How to add PivotPoints.All-In-One in MT4
Follow the instructions below to install the Indicator to your MT4 terminal:
Download the ZIP-archive with PivotPoints.All-In-One indicator file by clicking the link at the top of the page;Unzip the file into the MQL4/indicators folder of your terminal;Restart the MT4 terminal;Run the indicator by double clicking the indicator name in the MT4 Navigator;Check the “Allow DLL imports” box and click “OK“;The indicator will be displayed on the chart;Adjust the indicator’s settings according to your needs: press CTRL+I, select the indicator from the list, and switch to the “Inputs” tab.
Xem thêm: Câu Chuyện Làm Mẹ Bỉm Sữa: Mẹ Sau Khi Sinh Nên Uống Nước Gì, Chú Ý Kẻo Hối Hận Mẹ Nhé!
If you have any difficulties while installing the indicator, please view the detailed instruction.